


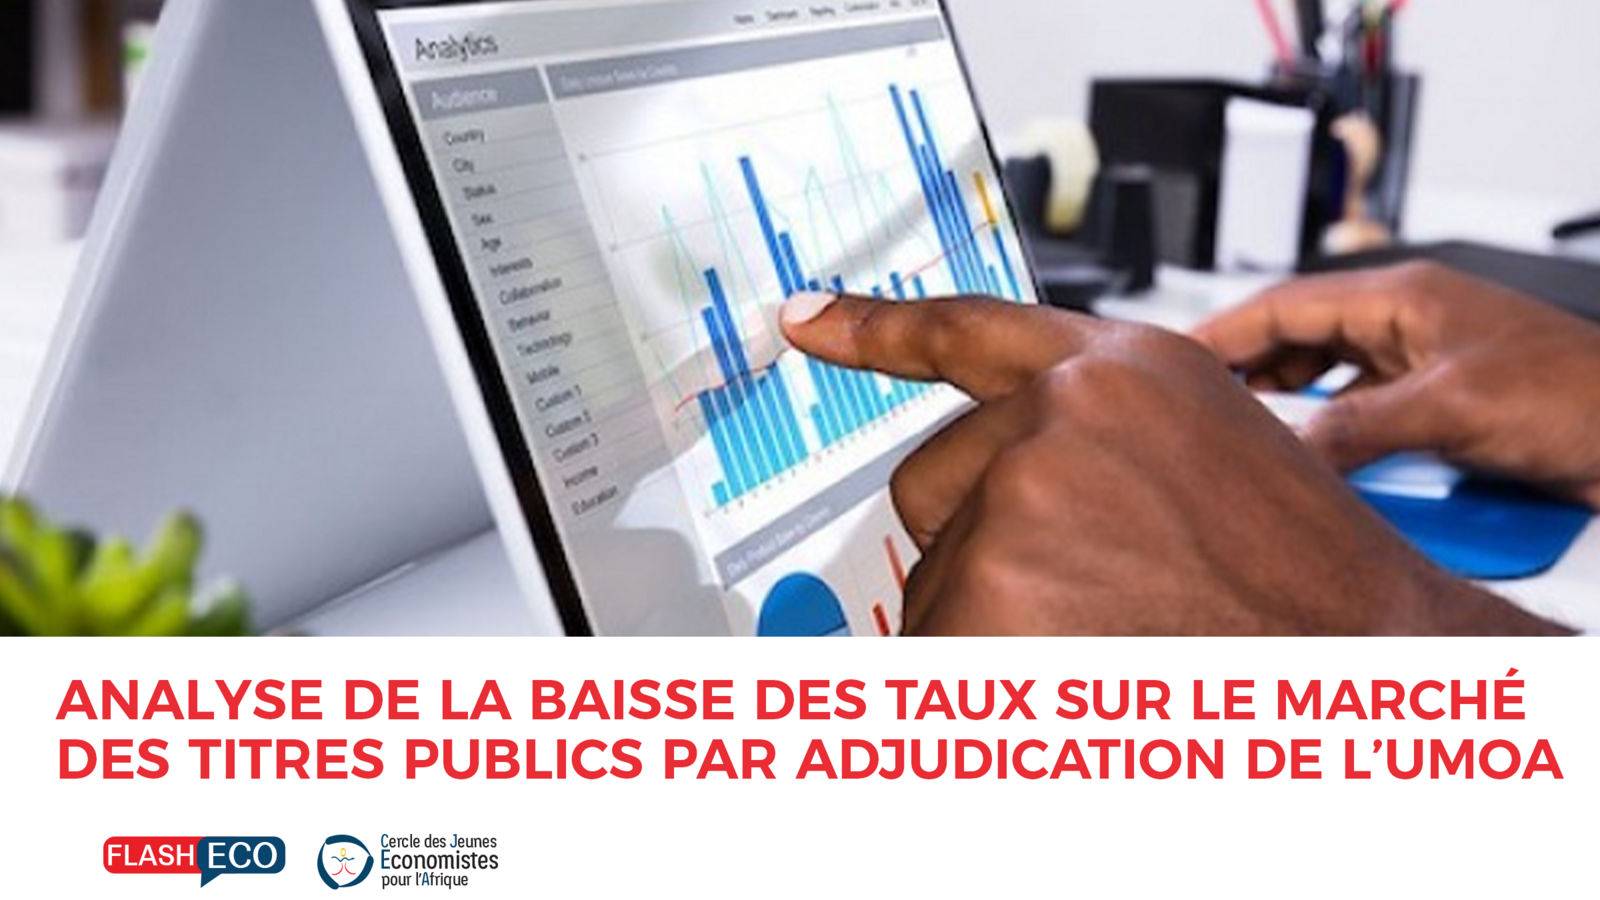
The WAMU auction market is a market on which the eight (08) member states of this zone issue debt securities to mobilize financial resources to finance their budgets.
In this study, we review the evolution of yields in this market from 2018 to the first half of 2021 (H1 2021).
|
Evolution of the average Weighted Average Rate (WAR*) in the WAMU |
||||
|
Year Maturity |
2018 |
2019 |
2020 |
S1 2021 |
|
6 months |
6,12% |
5,50% |
4,32% |
3,04% |
|
1 year |
6,20% |
5,31% |
4,69% |
4,16% |
|
3 years |
7,57% |
6,45% |
6,22% |
5,61% |
|
5 years |
7,30% |
6,77% |
6,34% |
5,93% |
|
7 years old |
6,25% |
6,35% |
6,48% |
6,12% |
|
10 years |
- |
- |
6,50% |
6,23% |
|
Evolution of the average Coverage Rate (CT**) in WAMU |
||||
|
Year Maturity |
2018 |
2019 |
2020 |
S1 2021 |
|
6 months |
120,04% |
136,50% |
168,63% |
157,44% |
|
1 year |
123,96% |
225,64% |
180,13% |
210,85% |
|
3 years |
83,80% |
179,12% |
140,64% |
133,13% |
|
5 years |
36,74% |
165,43% |
111,43% |
131,20% |
|
7 years old |
93,00% |
79,06% |
116,27% |
142,73% |
|
10 years |
- |
- |
28,00% |
111,21% |
|
Evolution of the number of issues in the WAMU |
||||
|
Year Maturity |
2018 |
2019 |
2020 |
S1 2021 |
|
6 months |
10 |
9 |
14 |
16 |
|
1 year |
45 |
37 |
35 |
13 |
|
3 years |
42 |
37 |
62 |
28 |
|
5 years |
16 |
23 |
47 |
25 |
|
7 years old |
1 |
5 |
20 |
18 |
|
10 years |
- |
- |
3 |
5 |
|
Total |
114 |
111 |
181 |
105 |
Sources: compiled from auction results
Weighted Average Rate (WAR): corresponds to the actuarial rate of return obtained by keeping the bond until maturity.
TMC=i=1nTi*OiO where Ti is the interest rate of the bid Oi ; O the total value of the bids; and n the total number of bids.
Coverage Ratio (CR): the rate at which the amount tendered is covered by bids. TC=Montant total des soumissions recueilliesMontant émis
Since 2020, we have been witnessing a revolution and a normalisation of the WAMU government securities auction market. Indeed, since 2019, this market has been recording a continuous decline in yields that has become more and more pronounced in recent months, with the lowest yields in the market's history.
On the 1-year maturity, the average weighted average yield in the WAEMU fell from 6.20% in 2018 to 4.16% in the first half of 2021. For the 5-year maturity and over the same period the yield fell from 7.30% to 5.93%.
If on the 7-year maturity, the yield went up between 2018 and 2020, this could be explained by the fact that this maturity remained the longest maturity until 2020. But in 2021 the yield on the 7-year maturity fell from 6.48% in 2020 to 6.12% in H1 2021.
In addition, issues with longer maturities are more regular and the yields on securities, even though they are falling, now move in line with their maturity.
While the longest maturities available on the market in 2019 were those of 5 years (7-year securities being rare: 05 issues in total), since 2020 issues of 7-year maturity have multiplied to cover 7 of the 8 WAMU member countries. In addition, 10-year securities have been issued since 2020 (3 issues) and are becoming more regular in H1 2021.
Similarly, while issues with lower maturities were often more remunerative than those with higher maturities, since 2020 this trend has become more normal. Thus, in 2020 and H1 2021, yields are an increasing function of maturities.
While this trend of continuously declining market rates can be explained by the strong demand for securities, as reflected in bidding coverage rates, the improvement in coverage rates even for longer maturities would be supported by certain factors.
The fall in market rates is an advantage for issuing States which are asking to mobilize longer resources at competitive costs. The States with the help of the WAMU Securities Agency are therefore working towards this end. Indeed, the States of Côte d'Ivoire, Senegal and Benin have already been soliciting the international debt market for some years now for very long maturities (over 20 years) at lower interest rates than those offered by the regional market, and with larger volumes.
This recourse to the international market does not favour the promotion of the regional market, in the sense that the mobilization of a significant volume of debt on the international market limits the recourse to other borrowings to respect the debt ratio. The decline in rates on our market and the greater possibility of mobilizing long resources with significant volumes would promote the development of the regional market.
Some measures taken by the BCEAO since 2020 also contribute to the fall in rates. With the advent of the Covid 19, the need for financing of States has increased to cope with the consequences of the pandemic. Thus, instruments such as Covid 19 Bonds and Recovery Bonds have been structured, with the will of the BCEAO to support the States in mobilising resources at low cost. Thus, a special 3-month refinancing window was set up to enable banks to refinance the Bonds. It should be noted that WAEMU banks intervene on the market on their own account and finance more than 90% of the issues on the market. Another special refinancing window called the "revival window" for revival Bonds was set up to refinance Bonds for a minimum period of 6 months.
The continued decline in interest rates on the securities market may result in the withdrawal of individual investors or legal entities other than banks. These investors are looking for better yields and prefer shorter maturities. However, the subsequent reduction in interest rates on traditional savings products could slow the withdrawal of these investors.
In any case, retail investment in the government securities market remains low.
Read the whole post
African stock markets are struggling to keep up with the continent's development. This situation is due to several factors, notably the timid interest of the private sector, the absence of privatization, and competition from the major world stock exchanges.
Yet almost all economic policies adopted by emerging and developing countries to accelerate their growth focus on improving the mobilization of long-term resources, which are usually found in capital markets.
At the end of 2019, the African continent had 32 stock exchanges, with about 2,000 listed companies, compared to 5,899 in China, for a market capitalization of $1.4 trillion, or 60% of the continent's GDP, compared to 82.89% for China. In addition to these data, there are profound differences between the markets. Daily trading on the continent's leading stock exchange, Johannesburg, which has a capitalization of over $1 trillion, amounts to $13.8 billion, which is about the same as the total capitalization of the Mauritius Stock Exchange in Port Louis ($14.9 billion). All these indicators reflect the insufficient contribution of African markets to the development of the continent due to their low utilization. Moreover, despite the many advantages of going public (capital gains on sale, cessation of subsidies, improvement in tax revenues, popular shareholding, etc.), it is not favored by private companies on the continent when they seek to raise long-term capital, with the exception of a few large companies in the financial or telecommunications sector (Ecobank, MTN, BMCE Bank of Africa, Vodacom, Safaricom, etc.).
It is also said that the continent's stock exchanges are neither liquid nor deep. They would therefore not attract African companies, which would prefer London or New York. But the liquidity and depth of a capital market cannot be decreed. They are created within a virtuous circle: admission of new companies to the list, financial information and investor education, liquidity, attraction of new investors, market depth, admission of new companies to the list. Africa, with its potential of corporate investors and the development of its middle class, a new category of individual investors, who should be informed and educated financially, can succeed in setting up this mechanism. The continent's development therefore depends on the integration of its banking systems and capital markets and the mobilization of the long-term resources needed to finance infrastructure and industrialization.
Source: Jeune Afrique, 2019
Read the whole post
In all economies, production can be divided into two parts: what is sold on the market and what is allocated by the state. The part of output that is sold on the market is referred to as market output and that which is subject to state appropriation is non-market output. The non-market sector includes public services (government) which are valued on the basis of their cost, essentially wages paid. The market economy, on the other hand, includes market goods and services. The distinction between the market and non-market sectors therefore leads to a dissociation between market and non-market GDP.
In Benin, the non-market sector is growing much faster than the market sector. In other words, non-market value added is growing at a higher rate than market value added. (Figure 1).

Figure 1: Evolution of market GDP vs non-market GDP in Benin. Year 2008 = 100. BCEAO data
There is also another way of looking at the highlighted phenomenon. From 2000 to 2005, the weight of the state in relation to the private sector fell. Since 2005, the growth of the Beninese economy has been driven by the growth of the public sector (Figure 2). Without discussing the efficiency of public spending, it should be remembered that the financial resources of the non-market sector come directly (via taxes) or indirectly (via the debt, which is only future taxes) from the market sector. Therefore, if the non-market sector grows faster than the market sector, there is bankruptcy on the horizon.

Figure 2: Ratio of non-market GDP to market GDP in Benin. Year 2008 = 100. BCEAO data
Benin's drift towards a non-market mode of production poses financing problems and increases the stock of public debt. Indeed, in Benin, structural growth (GDP per capita growth) evolves in almost the same way as the stock of public debt (Figure 3). This leads to the following remark: in the case of Benin, GDP growth should not be confused with growth in market value added.

Figure 3: Evolution of public debt stock vs. per capita GDP growth in Benin. Data BCEAO, World Bank
Read the whole post

Stock market speculation is a practice which consists in carrying out a series of purchases and sales of values or financial securities with the aim of quickly realizing capital gains. Speculating is therefore betting on the rise or fall of stocks or securities without actually buying them.
There is a famous saying that one man's loss is another man's gain. In this perspective, famous American investment funds having noticed that the video game company GameStop listed on the New York Stock Exchange was in crisis, they tried to make money by betting against it. They decided to do what is called "short selling" by first borrowing massively shares that they did not own, then selling them at a high price, and then waiting for the price to drop before buying them back at a discount and returning them to the entities they had borrowed from. Their position was confirmed in mid-January by Wall Street analysts who estimated by their models that the price of GameStop shares will fall.
However, a community of amateur traders gathered on a forum called WallStreetBets thwarted all the models by believing that it was possible to get rich by betting on a rise in GameStop's share price instead. They also found an opportunity to trick the big institutional players on Wall Street by coordinating to buy massive amounts of GameStop stock and drive up its value. It was a complete success!
GameStop's stock prices have become very volatile. Prices increased by 168% between February 19 and February 25, 2021. Prices then continued to rise, reaching $264.48 on March 12, 2021. As a result, while hedge funds lost millions of dollars, amateur traders made millions of dollars, damaging the system. The hedge fund Melvin Capital, a major US investment fund,
was one of the biggest losers as he had bet on a decline in GameStop's share price. He was forced to accept huge losses by buying back all the GameStop shares sold.
previously discovered. According to the Financial Times, the known losses of Melvin Capital, for example, are estimated to be around $3.75 billion.
This situation has prompted the U.S. securities regulator, the SEC, to strengthen oversight related to
the valuation of the GameStop share price for all players, as certain strategies are not allowed on the stock exchange and no one has the right to lie or spread false information in order to raise or lower the price of a share and manipulate the market in his or her favor
From all the above, it is clear that speculation plays an active role in accelerating the rise or fall in the value of assets on the markets. It can be destabilizing for the financial markets given the strategies of speculators and the limited time horizon, i.e. the short term. An investment in shares should be considered on the long term beyond the expected quick gains, as George David maintains: "if you don't invest on the long term, there is no short term".
Read the whole post
By definition, trading includes all buying and selling operations carried out on the financial markets. It is organized in two ways depending on the position of the operators (traders) who engage in it. On the one hand, we talk about traditional trading when the traders issue operations directly from the financial market room, and on the other hand, we talk about online trading when the latter involves independent traders who issue via the Internet. Who can trade?
If traditionally, this activity was carried out only in the local stock market, the development of the Internet with increasingly reduced accessibility costs, constitutes a real asset for any operator allowed to exercise as an online trader. However, it is necessary to have a very good internet connection and to be permanently connected to follow instantly the evolution of the values of the financial products in order to take advantage of it.
In terms of advantages, trading allows traders to speculate in the short term by taking advantage of the mobility of the financial products traded (stocks, bonds, etc.) on the market. However, this activity is risky, especially because of the volatility of the market and the high level of fraud, which can be explained by the proliferation of online trading platforms with deceptive but very attractive advertising. For example, in Africa, certain structures such as GLOBAL INVESTMENT TRADIND, GLOBAL TRADE CORPORATION, HIGH LIFE and CHY MALL were ordered by the Regional Council of Public Savings and Financial Markets (CREPMF) in Abidjan to suspend their activities in its communiqué of 18 March 2021 1 . These structures specializedcrypto-currency trading, among other things, offer very attractive but highly risky interest rates, sometimes putting the public at risk. What should the public do now about the risks of trading?
The Forex Brokers SA (South Africa) report, published in December 20192 states that the SEC (Securities & Exchange Commissions) urged investors in its statement issued in 2018, to be discerning so as not to fall prey to the scam seen in online trading which is much more on the rise in Africa currently.
Indeed, the data presented in the report indicates that this activity has been growing rapidly in Africa since 2019 especially in South Africa and Nigeria which occupy the top ranks. The number of traders was estimated at 1.3 million in Africa with nearly 190,000 and 200,000 for South Africa and Nigeria respectively.
Finally, trading is certainly on the rise in Africa, but this progression must be accompanied by financial education for beginners on the one hand and regulation of the exchange system by the authorities on the other. Professional training centers are already multiplying in Africa (for example, the Beninese Trading Center, CBT), not to mention the major trading schools that include trading as a course of study. In these training centers, investors as well as traders could thus acquire skills and analysis tools allowing them to have a profitability on the financial market while having the mastery of risks.
Read the whole post
The economy of the Republic of Congo, which is essentially based on its oil revenues, has been undergoing one of the most difficult crises since the fall in oil prices in 2014. Between 2013 and 2017, the world price of oil fell by an average of 15.5%1 each year, i.e. a 49% drop over the entire period. This has led to a drop in the rate of growth of economic activity, to -10% in 2016.
Figure 1: Oil prices and GDP growth rate (annual %)

Source: CJEA, IMF, World Bank.
With total public debt representing 117.5% of its GDP in 2017, this complex situation led the Republic of Congo and the Executive Board of the International Monetary Fund (IMF) to a loan agreement for US$ 448.6 million on 17 July 2019. This agreement under an extended credit facility is an IMF programme that prioritises structural reforms and targets governance for better economic diversification and inclusive growth. It also works towards fiscal rebalancing and debt restructuring. Finally, the programme aims to strengthen human capital through the protection of vulnerable populations.
Following the disbursement of the first tranche (USD 44.9 million), the IMF press release of January 2020 set out the Congolese economic landscape, reporting overall growth revised downwards to 2.2% in 2019, due to the lower-than-expected expansion of oil production. From 2020 onwards, oil production is expected to continue to decline as the oil fields reach maturity2. However, by 20243, non-oil growth is expected to increase by an average of 14% per year, but this trend will depend mainly on the performance of agriculture and transport.
Figure 2: Projected non-oil growth (%), 2021-2024

Source: CJEA, IMF.
The country's external public debt has increased significantly since 2010. There is a significant accumulation of external trade arrears, notably to oil traders4 (18.1% of GDP). In addition, domestic public debt has also increased from 15% of GDP in 2014 to 25.5% in September 2019. China provides the bulk of external financing and Congo's external debt to China in September 2019 was USD 2 213 million, or 20.4% of the Republic of Congo's GDP. Although the two countries have reached an agreement to restructure Congolese debt (to China)5 , the total external public debt remains unsustainable. Indeed, the ratio of the present value of external public debt to GDP stands at 46% in 2021, above the sustainability threshold of 30%.6
The end-June results of the IMF assessments of the programme7 are considered mixed. Both quantitative budgetary targets have been met. These are the floor for the basic non-oil primary balance and the ceiling for the government's net domestic financing. The achievement criteria setting a zero ceiling for non-concessional financing and new external debt guaranteed by future natural resource revenues were also met. There was, however, an accumulation of new external arrears of about USD 20 million, thus failing to meet the continuous external arrears achievement criterion. In addition, the three indicative targets related to non-oil revenues, poverty reduction expenditures, and disbursements of external loans for investment projects were also not met.
In the end, the disbursement of the first tranche of the July 2019 programme was the only one.
Now affected by the Covid-19 pandemic, the National Social Security Fund has benefited from an IMF loan of CFAF 200 billion to ensure the payment of pensions in the private and parapublic sectors. It should be remembered that the arrears of payment on pensions and social benefits represent 3.4% of GDP in 2019 (IMF).
Given the debt arrears, structural budget deficit, and IMF assessments concerning social spending deemed insufficient, and in the context of a global pandemic, will the Republic of Congo manage the latest IMF loan efficiently for the benefit of its population?
Read the whole post
In response to the global recession caused by the COVID-19 pandemic, several countries around the world have put in place an economic stimulus package that can stem the effects of the crisis and put them in a situation close to that which prevailed before the pandemic. Estimates from the International Monetary Fund (IMF, 2021) show that global budget support in 2020 was approximately $14 billion. Despite funding difficulties, African countries are not on the sidelines of these plans by becoming "Keynesian". Expansionary fiscal policy is being used to support aggregate demand and achieve development goals. According to the IMF's latest forecast published in January 2021, these additional support measures in these countries, combined with the recent approval of several vaccines, have led to an upward revision of global economic growth forecasts for 2021 by 0.3 percentage points from the previous forecast. Although according to Blanchard et al (2010), the 2008 crisis reaffirmed the value of fiscal policy as a countercyclical instrument, should African economies automatically expect a return to their pre-crisis levels through increased public spending?
Theoretically, several economists have explained the relationship between government spending and growth by emphasizing its components. For example, Keynes (1936) considers government spending as an exogenous factor that can be used as a policy instrument to promote economic growth. In this sense, he considers that an increase in consumption is likely to lead to an increase in the level of employment and private investment through multiplier effects on aggregate demand. Wagner (1892) showed that the elasticity of public spending in relation to gross domestic product (GDP) is greater than one. According to the "Big Push" theory presented by Paul Rosenstein-Rodan (1943), an aggregate investment program can be useful to sustain economic growth. Endogenous growth theory also argues that fiscal policies can be used to improve the efficient allocation of resources by correcting market failures especially in times of crisis. However, for economists of the "classical" school, the effectiveness of fiscal policy is not always guaranteed.
Empirically, many studies have also been conducted to analyze the relationship between public spending and growth. In the existing literature, some studies focus on a specific country, while others are applied to a set of countries in panel form. These studies have sought to analyze the direction, nature and significance of the impact of one variable on the other.
In Africa, Keho (2015) studied the causality between government spending as a percentage of GDP and real GDP per capita on a panel of nine countries. The results indicate that Wagner's law holds for Cameroon in the medium term, for Ghana in the short, medium, and long term, and for Nigeria in the long term. The Keynesian view is supported for Gabon and Senegal in the short, medium, and long run and for South Africa in the medium and short run. For Senegal, this result is consistent with Nubukpo (2007) in the long run but contradicts it in the short run. Therefore, all three countries can use public spending to stimulate their economies, as the Keynesian paradigm claims.
In the WAEMU, Tenou (1999) shows that an expansionary fiscal policy reduces per capita GDP growth in WAEMU countries. Similarly, Nubukpo (2007) shows that, except for Senegal and Togo in the long run, total government spending does not have a positive effect on growth in WAEMU economies. This result corroborates that of Ojo and Oshikoya (1995). However, Nubukpo (2007) concludes that public spending can be growth-enhancing for WAEMU economies when it is directed at investment, but is also likely to be a drag on growth when it focuses on consumption.
All these results are often contradictory, varying from one country to another and ranging from "bidirectional causality" to "non-causality" between the two variables. All these theories and empirical results have not unilaterally decided that fiscal stimulus is the most effective tool to bring the economy back to its pre-crisis level. But it is clear that the announced stimulus could create additional wealth if the emphasis is placed on productive investment. Keynesian theory, the "Big Push" theory and some empirical results obtained in a few African countries remain optimistic that fiscal stimulus plans are the key to promoting a rebound in economic activity.
Read the whole post
Il est important de noter les efforts consentis par l'administration béninoise, au moins en termes de structure, y compris le renforcement numérique. Mais la question fondamentale est de savoir si la révolution numérique va nous permettre de résoudre le problème de la corruption et, plus largement, de la mauvaise gouvernance au sein de nos États.
The phenomenon of corruption is well known in our countries (from the least literate in the village to the well-to-do executive in the administration). But beyond corruption, our countries suffer from many ills that slow down their development. The "government effectiveness" index proposed by the World Bank evaluates the perception of the quality of public services, the quality of the civil service and its degree of independence from political pressure, the quality of policy formulation and implementation, and the credibility of the government's commitment to these policies. This index for WAEMU countries has remained below 0. This reflects the relatively weak governance in these countries.
Indeed, in the majority of our countries, the populations do not have access to services, or the services are reserved for a part of the population that can pay.
Figure 1: Evolution of the "government effectiveness" governance indicator in WAEMU countries

Source: CJEA based on WDI/BM data
La révolution numérique, en éliminant les intermédiaires, limite les fuites et la corruption. Cependant, il reste essentiel de renforcer la qualité de nos institutions, pour une gestion efficace des revenus et la réduction des inégalités. Face à la crise du COVID-19, où le mot d'ordre pour tous les pays est «Tout ce qu'il faut», de vastes plans de relance sont en cours. Pour que ces plans soient efficaces, il est nécessaire de veiller à ce que les populations, en particulier les plus pauvres, aient un accès équitable aux services.
Read the whole post
But what is going on in Turkey?
On Monday 22 March 2021 the Turkish lira fell by more than 9% against the euro.

Source: CJEA based on ECB data
An announcement that Turkish President Recep Tayyip Erdogan had sacked the head of the Turkish Central Bank, Naci Agbal, at that time seems to have had an impact on the Turkish lira.
The reason for the dismissal was a disagreement on the impact of interest rates on inflation. According to the Turkish president, lowering interest rates would stimulate strong growth (financed by cheap credits) and would eventually be beneficial for inflation.
In contrast to this theory, the now former head of the Turkish Central Bank, Naci Agbal, pursued a policy of raising interest rates in order to curb the country's rising inflation. He raised the central bank's key interest rate by 200 points two days before his dismissal was announced.
So what is the theory on the link between interest rates and inflation?
According to the commonly accepted theory, the lower the interest rate, the easier it is for households to borrow, and therefore to consume. This increase in consumption would then lead to a general rise in prices, inflation. This is known as demand-side inflation. Thus, by the same mechanism, a rise in interest rates encourages households to favour savings, thus lowering the level of consumption and then inflation.
We observe an increase in the consumer price index in March 2021 :
- compared to the previous month by 1.08%,
- compared to the month of December of the previous year by 3.71%,
- compared to the same month of the previous year by 16.19% and on the basis of twelve-month moving averages by 13.18% in March. This is one of the highest inflation rates since July 2019.
It remains to be seen what impact the various policies put in place will have on this inflation.
As a reminder, Turkey is one of the countries of destination of rubber exports (which represented 3% of goods exported by the union in 2019) of the WAEMU.
Read the whole post
